Overview
# General
In the “Evaluation” area, you can examine your simulations by viewing the simulation process in charts.
You can create as many charts as you like in this area, with various chart types and data compilations available.
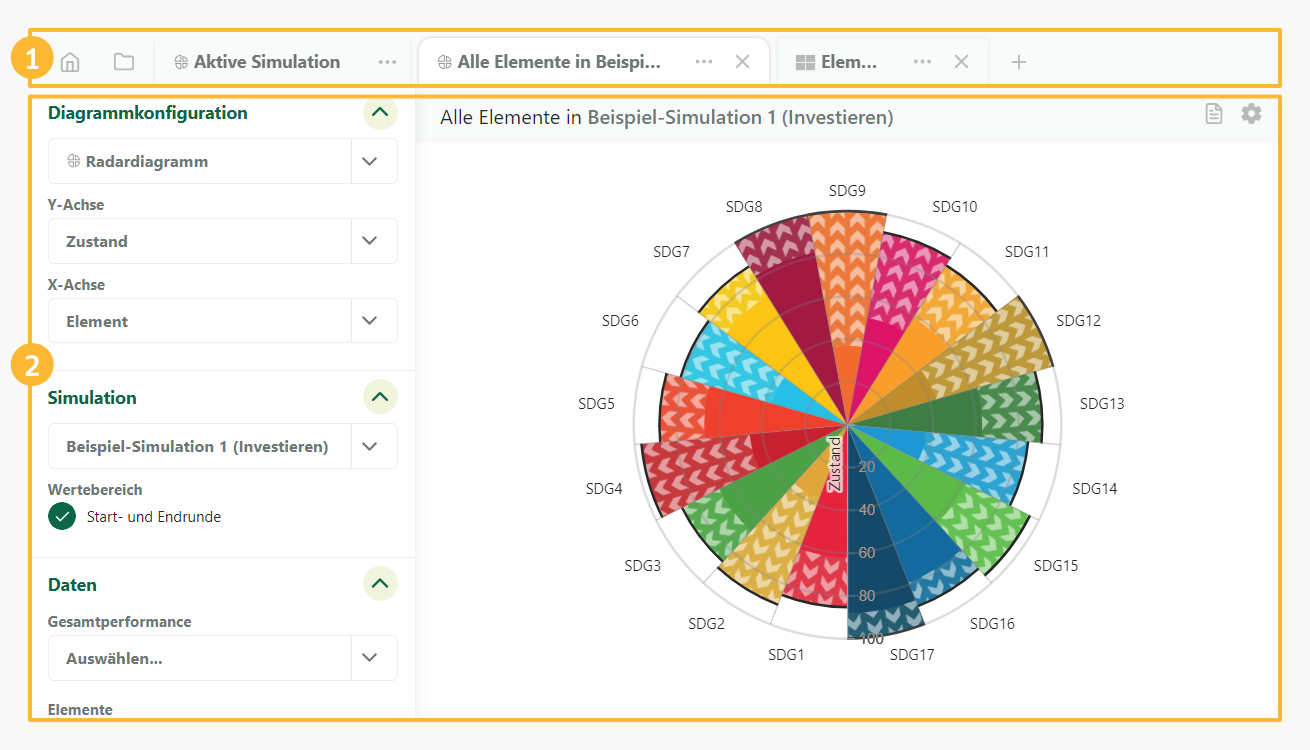
The evaluation area is divided into two sections:
- The tab navigation
Here you can select the open chart and create new charts or chart overviews. - The chart area
The currently open chart or the open chart overview is displayed here.
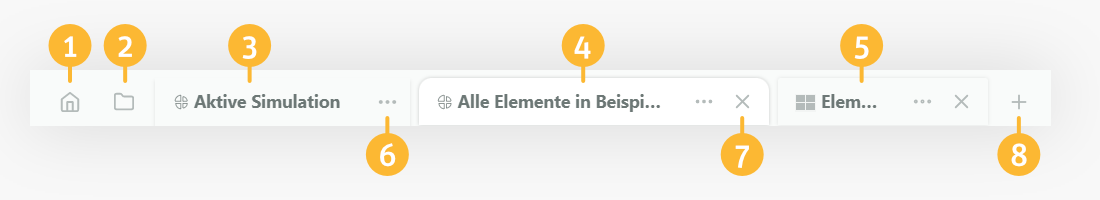
# Chart tab navigation
Several charts can be open at the same time in the Evaluation area. You can quickly switch between all open charts in the tab navigation. The tabs can be rearranged using drag-and-drop.
Charts that you do not currently need can be closed with a simple click. All charts are automatically saved and can be reopened at any time, either via the start page or via the quick access menu.
- Link to the start page of the evaluation area
- Quick access to saved charts
- Chart for active simulation
- Chart tab
- Chart overview tab
- Button: Open context menu
- Button: Close tab
- Button: Create new chart
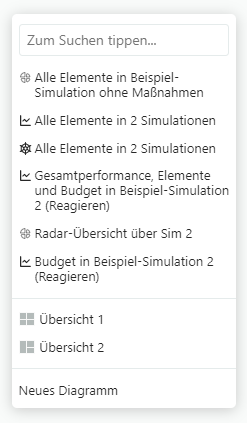
# Quick access menu
All closed charts and chart overviews are displayed in the quick access menu. All of them can be opened with a click.
The entries can be searched using an input field.
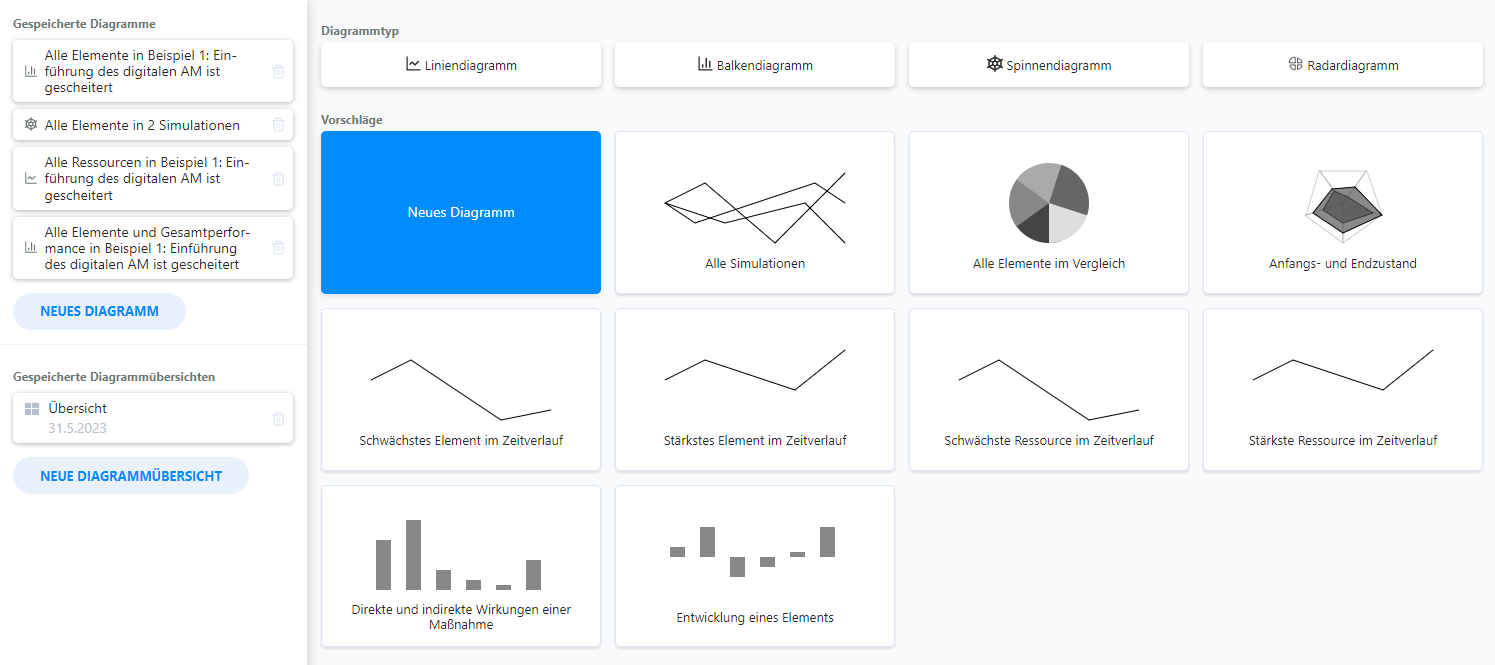
# Home page
All saved charts and chart overviews are listed on the start page of the evaluation area, and there are also quick templates for creating new charts with pre-selected data.
On the left-hand side is an overview of all saved data in the chart area. Click on an entry to open it.
On the right-hand side you will find templates to quickly create a new chart. Clicking on one of the templates immediately creates a new chart with the corresponding data.