Views

# About Views

Views will be available in simcision 3.10+. That version will be published in March.

đź”’ Views are an advanced feature and are only available to users with a paid simcision subscription.

With views, you can divide your model into multiple visually separated areas. In each area, you can place your own elements and relationships, add text, and embed media.

During the simulation of the model, the content of all your views is calculated. You can create connections between your views by using the same elements in multiple views — the state of your elements is shared across all views and is influenced by all relationships and flows from every view.

Views help you to…

  • Model systems from different perspectives
    When looking at a system from different viewpoints, rearranging its elements can help present relationships more clearly. With views, you can reorganize the same network and, for example, display only the relationships that originate from a specific perspective.
    Example: The element “Forest Stock” plays a role in the perspective of “Forestry,” but also in the perspective of “Urban Planning.” Depending on the perspective, new relationships and a different context emerge for the element.
  • Create individual dashboards
    Especially when building playable simulations, you may want precise control over what players can see. Views allow you to place your entire game system—including all relationships, flows, and auxiliary values—on one view, and design the actual game interface as a “dashboard” on another.
    You might want to create a compact “control center” that mainly contains sliders for your elements. Or perhaps a data view that primarily displays charts to provide context about what has happened during the simulation. In public links with access control, you can define which of your views your players are allowed to access.

Good to know: Views significantly increase the complexity of your models if you distribute the functional parts of your system across them. It becomes harder to trace why a value has changed, since not all relationships and influencing factors are always visible. Consider carefully how views support your goal before using them.

# Szenenleiste

You can find the view bar in the lower right corner of the workspace. All settings available there are linked to the respective view.

  1. View Management
    Here you can select and manage your views.
  2. View Design
    Choose the background image, background color, font size, and template of your view.
  3. Zoom
    Define the zoom level of the currently open view.
  4. Visibility
    Choose what should be visible in the view: relationships, flows, index connections, guiding question, …
  5. Layers
    Manage the layers of your view and define what is visible or locked.
  6. Fullscreen
    Open simcision in fullscreen mode.

View Management

Here you can set up and organize the views of your model.

  • Select “New View” to create a completely new, empty view in your model. The view is selected immediately, and you can start adding content right away.
  • You can double-click on view entries or click the pencil icon to edit their names.
  • Using the context menu under “…” you can duplicate or delete a view.
  • Drag & drop views to reorder them.
  • As long as you only have one view, the view bar displays only the view icon. Once you have multiple views, their titles are shown there. You can change this setting by right-clicking on the view icon.

View Design

Use this menu to customize the background of your view. Each view can have its own color scheme and background images.

Settings:

  • Template
    Templates provide a fixed layout displayed behind your network, allowing you to quickly create elements following a predefined structure.
    Templates contain placeholders and sections:
    Placeholders: Clicking a placeholder creates an element at that position.
    Areas: Areas divide the network into visual segments. Each section has a name, which can be renamed in the template menu.
    The template can be deactivated at any time, existing elements will not be affected.
  • Font Size: You can define a base font size for your view. All texts in the network will scale accordingly. However, many text elements can also define their own individual font sizes.
  • Background Color: Defines the color of the workspace.
  • Background Image: The selected background image is placed behind all objects in the network. It does not move when you pan or zoom the workspace. You can choose whether it is displayed in full, scaled to fill the workspace, or shown in its original size.
  • Footer Anchored: By default, the bottom panel overlays the network. Optionally, it can reserve its own space below the workspace, which will then reduce the size of the workspace accordingly.

Zoom

In this section, you can adjust the zoom level of the selected view. By default, a slider is displayed. You can customize the menu via right-click to show only buttons or an input field instead.

Visibility

In the view visibility menu, you can define what is visible in the current view. You can show or hide connections, display or hide the central guiding question, and control what information is shown inside elements.

Layers

Each view is divided into layers. Layers allow you to group objects within a view and show or hide them collectively.

There are three types of layers:

  • Foreground Layer:
    This layer sits above all others. Only elements are displayed here.
    Elements in this layer are not part of the main impact network. Instead, they are displayed in lists at the edge of the workspace. This is useful for consumption resources and key values that need to remain visible at all times.
  • Scene Layer
    This is the standard layer containing all network objects: elements, text, shapes, charts, and images.
    You can change the display order of objects here by reordering them via drag & drop. Items higher in the list are shown further in the foreground in the workspace.
  • Connection Layer
    This layer contains all system connections: relationships, flows, and index links.

Functions in the Layer Menu:

  • You can group objects within scene layers if you need more structure.
  • Groups and layers can be hidden, which will hide all objects they contain.
  • Groups and layers can also be collapsed for a cleaner structure.
  • All objects and layers can be locked. Locked objects can no longer be moved. If a layer is locked, none of its objects can be clicked.
  • You can create a new layer using the button at the bottom of the layer menu. Only scene layers can be created. The foreground layer and the connection layer are created automatically and cannot be deleted.
  • When you select a scene layer, all newly created objects (elements, media, text, etc.) will automatically be placed on that layer.

# Views in publications

If you have created views, you can restrict their visibility when publishing your model. Anyone who opens your model via that public link will not have access to hidden views and can only choose from the available options.

🔒 Views are a Pro feature and are only available with a paid simcision subscription. In addition, the “Public Link Configuration” upgrade is required to enable visibility settings for published models.

Please note: Restrictions on public links apply only to public access. If the model is shared with permission to duplicate, the duplicated model has no restrictions—full access to all areas and views is possible. If you want to prevent this, you should not allow the model to be duplicated.

Texts, Shapes, Media and Charts

# Design Tokens

Design your model’s canvas in simcision! Use free text, images, and shapes to document, highlight, or enrich areas of your system. A picture is worth a thousand words – and a well-designed model is much easier to understand.

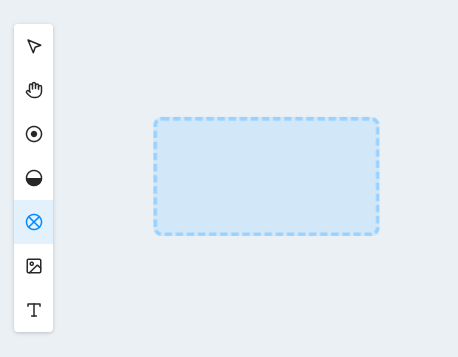
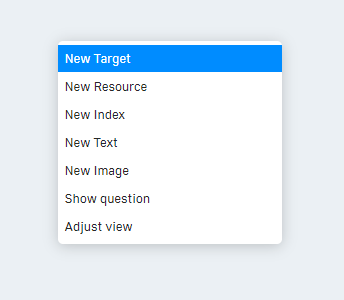
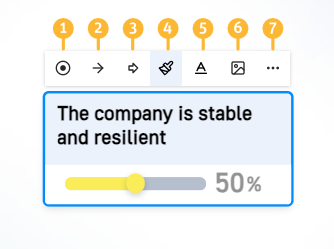
In the toolbar of the impact network, you’ll find four design elements you can place in your network:
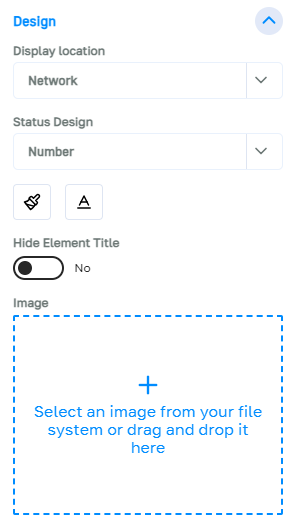
# Media

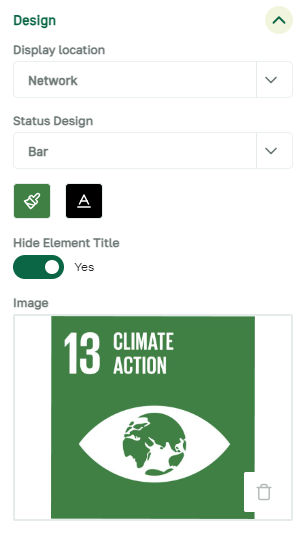
Externally created media can be embedded in simcision models.
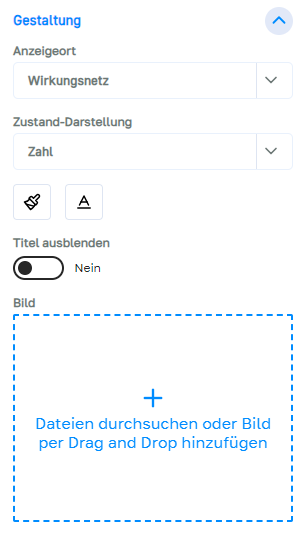
Insert new media

  • Select the media icon in the toolbar
  • Drag a region in the impact network
  • Choose a media file to upload

Supported formats

  • simcision supports embedding images (PNG, SVG, JPG, WebP, AVIF, GIF, …) and videos (MP4) in the network. Videos are played muted and in a continuous loop.

Edit media

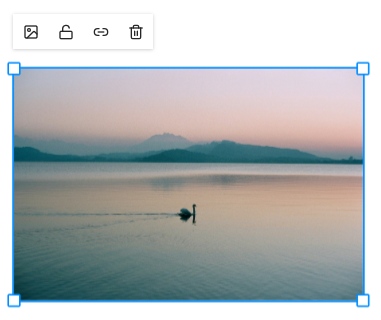
  • Media placed in the network can be moved via drag-and-drop, scaled via sides and corners, and rotated using the outer corners.
  • Use the lock icon in the toolbar to lock the position and size of media in the network – once locked, media can’t be moved.
  • By default, media can only be scaled proportionally (aspect ratio locked). You can toggle this lock via the chain icon.
  • You can replace the media via the media icon in the top-left corner.

Note: Media files are often large and can negatively impact loading times and memory usage. Compress all media before inserting it and only use the size you truly need. Modern formats like WebP are generally smaller. Vector files (SVG) can be scaled infinitely and remain sharp.

# Text

Use free text to document your models directly on the canvas.

Create new text

  • Select the text icon in the toolbar
  • Drag the desired text area on the canvas
  • Write your text directly into the newly created area
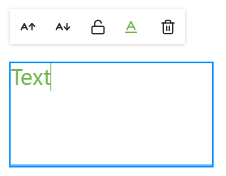
Edit text fields

  • Text fields can be moved via drag-and-drop, scaled via sides and corners, and rotated via the outer corners.
  • Use the lock icon in the toolbar to lock the position and size of text fields – once locked, they can’t be moved.
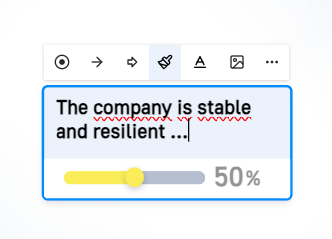
  • Font size can be adjusted via the buttons on the left side of the toolbar.
  • Font color can be chosen freely.
  • Text can also be formatted using special markup syntax (see formatting options for text fields).
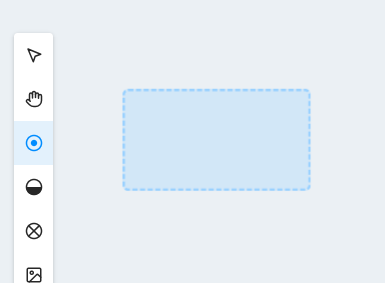
# Shapes

Use shapes to visually highlight areas of your system or create additional images for documentation.

Create new shape

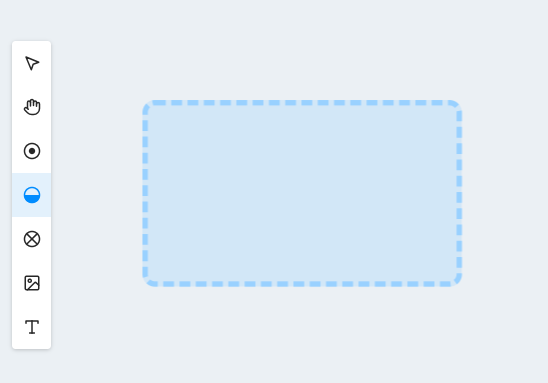
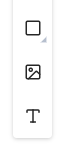
  • Select the shape icon in the network toolbar
  • (Optional: hold the icon to choose a shape – rectangle, circle, or triangle)
  • Drag the shape to your desired size and position in the network

Edit shapes

  • Shapes can be moved via drag-and-drop, scaled via sides and corners, and rotated via the outer corners.
  • Use the lock icon in the toolbar to lock the position and size – once locked, shapes can’t be moved.
  • Use the button in the left corner of the toolbar to change the shape type. Note: Switching types will overwrite the current shape.
  • You can customize fill color, border color, opacity, and line thickness via the buttons in the middle of the toolbar.
  • Colors can be entered as hex codes or selected via a color picker directly from the model.
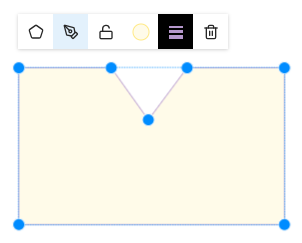
  • Use the pen icon to activate shape edit mode. In this mode, you can freely move all anchor points of the shape.

Helpful shortcuts in shape edit mode:

  • Right-click on an anchor point to smooth or round it. Rounding gives the point Bezier handles.
  • Double-click a point to delete it.
  • Double-click the edge of the shape to create a new anchor point.
  • Hold Shift while dragging a point to constrain it to a horizontal or vertical axis.
  • Hold Alt while dragging a Bezier handle to move its opposite symmetrically.
  • Hold Ctrl while dragging a Bezier handle to fix its angle relative to the anchor point.
  • Hold Shift while dragging a Bezier handle to snap it to 45° angles.

Note: A shape with fewer than two points will be automatically deleted.

# Charts

Use charts to show dynamic evaluation results during your simulation runs.

Create new chart

  • Select the chart icon in the network toolbar
  • Drag the chart to your desired size and position in the network
  • Configure the chart using the sidebar or the edit menu from the net context bar. To learn more about configuring charts, visit the charts page in the evaluation section. The charts in the scene have the same configuration options.

Important to know

  • For the chart to show data, the model needs at least one simulation run with simulated rounds. Choose the simulation to display in the “Simulations” section of the sidebar. The standard set here is the “Active Simulation” placeholder; while this is selected, the chart includes the data from the simulation open in the Simulation tab.

Edit charts

  • In the “Design” section in the sidebar, you can change the chart’s appearance and define which parts of the chart are visible.
  • Charts can be moved via drag-and-drop, scaled via sides and corners, and rotated via the outer corners.
  • Use the lock icon in the toolbar to lock the position and size – once locked, shapes can’t be moved.
  • Use ALT + Drag to duplicate the chart in the scene.

Stakeholder

# Create

Stakeholders are the interest groups that are

  • are affected by the issue
  • are involved in the solution
  • have an interest in the solution
  • may boycott a solution
  • Investors and employees of the project

Under the Stakeholder option in the impact network, you can create a new stakeholder using the “Add” button.

After clicking the button, a detailed view of the stakeholder opens in which you can add a title and a description.

You can use the “Targets” tab to select the targets that are of interest to this stakeholder.

You can use the “Resources” tab to select the resources that are of interest to this stakeholder.

You can use the “Indices” tab to select the indices that are of interest to this stakeholder.

You can use the “Actions” tab to select the actions that are of interest to this stakeholder.

You can delete stakeholders at any time using the small trash can next to their name.

Impacts

# About impacts

An impact always goes from one element (source element) to another element (end element). If the value of the source element changes, the value of the end element also changes.

The impact can be in the same direction:

  • The more…, the more…
  • The less, the less…

Or in the opposite direction:

  • The more…, the less…
  • The less…, the more…

Impacts are represented by a single dotted arrow connecting the outgoing element with the end element.

# Create

An impact between two elements can be created in various ways:

In the network

  1. Select the source element in the network so that the editing bar appears.
  2. In the editing bar of the element, click on the button to create the impact.
  3. Click on the desired end element in the network.
  4. In the pop-up window that appears, click on “Create impact”.
  5. The impact is created and selected. You can set the impact strength and alignment in the sidebar or in the effect pop-up menu.

In the element menu

  1. Select a desired output element or end element.
  2. Show the side menu and open the “Impacts” section.
  3. If the selected element is to be the output element, open the dropdown under “Outgoing impacts” and select an end element. Vice versa for an incoming impact.
  4. The impact is created. You can set the impact strength and alignment in the sidebar that appears.

# Mode of impact

In the “Mode of impact” tab in the action menu, you can set the extent to which a change in the state of the output element affects the end element.

The impact type determines how the effect is transferred: “Rectified” (the more A, the more B), “Reverse” (the more A, the less B) or no impact (no transfer, purely for documentation purposes).

The impact strength determines how strong the maximum change in the end element should be.

Example: The impact strength is 50 and the output element is a target with a value range of 0-100%. Both the output element and the end element have a status of 0%. If the value of the output element now increases from 0% to 100% in one simulation step, a pulse of 50 is given to the end element via the effect. (With standard settings)
If the output element had risen from 0 to 50%, only a pulse of 25 would have been applied to the end element.

Once the strength has been determined, the type of transfer can be further adjusted: In the influence curve, you can specify how much the end element should increase based on the value of the output element.

The curve is always evaluated if the value of the output element has changed in a simulation step.

The pulse passed on is calculated as follows:

  • First, the value of the curve before the change is taken.
  • Then the value of the curve is calculated with the new value of the output element.
  • The difference between these two values is the new impulse that is passed on via the impact.

Example:

  • Output element “Work” is set to 20%. The value of the curve is 10.
  • After a simulation step, “Work” is now set to 40%. The new value of the curve is 20.
  • The difference between the two results arrives at the end element as a pulse. Therefore, the end element “Results” now receives a pulse of +10 (20 – 10).

The curve can be set manually, but you can also choose from a range of predefined curves:

  • S-curve
  • Linear
  • Saturation
  • Exponential
  • Plateau
  • Gaussian curve

Alternatively, you can also define an exact curve by selecting the individual formula curve type. With this setting, you will receive an input field in which you can enter a formula. The formula has the format “f(x) = …” where x is the current value of the output element. Mathematical operators (+, -, /, *), brackets and functions can be used in the formula.

Available functions:

abs(A) Absolute value of A: abs(-5) = 5
ceil(A) A, rounded up: ceil(5.1) = 6
fix(A) A, Rounded towards 0: fix(-5.7) = -5
floor(A) A, rounded down: floor(5.9) = 5
mod(A, B) Modulus of A (remainder of an integer division): mod(5, 4) = 1
round(A) A, rounded: round(5.3) = 5
sign(A) Sign of A: sign(-5) = -1
sqrt(A) Square root of A: sqrt(9) = 3
square(A) A squared: square(3) = 9

Curves in the same direction always run from 0 into the positive range, whereas curves in the opposite direction always run from 0 into the negative range.

# Delay

Under the “Delay” tab, you can set how many time units should elapse between the change occurring at the outgoing element and the effects on the end element.

By default, an impact is evaluated directly after a simulation round, so the impulse arrives at the end element in the next round. It is possible to delay the arrival of the impulse by an unlimited number of rounds.

Flows

# About Flows

Flows are used to transfer values from one element to another.

Flows are activated in each simulation round; the value of the flow is subtracted* from the element at the start of the flow (source)**, the value of the flow is added to the element at the end of the flow (sink).

Flows can be limited: if there is no more space in a limited sink, the flow is automatically limited.

Flows are represented by a double-dashed arrow that links the elements involved in the flow.

* The value that is calculated for sources and sinks can also differ from the flow value, depending on the setting.

** Flows can theoretically also be connected to several sources and sinks. Or only with sinks. Or only with sources.


# Create

A flow between two elements can be created in various ways:

In the network

  1. Select the source element in the network so that the editing bar appears.
  2. In the editing bar of the element, click on the button to create the flow.
  3. Click on the desired end element in the network.
  4. In the pop-up window that appears, click on “Create flow”.
  5. The flow is created and selected. You can set the effect strength and alignment in the sidebar or in the effect pop-up menu.

In the element menu

  1. Select a desired source element or end element.
  2. Show the side menu and open the “Flows” section.
  3. If the flow is to subtract a value from the selected element, open the dropdown under “Outflows” and select the corresponding sink element. In the case of an inflowing flow, vice versa.
  4. The flow is created. The strength of the flow can be set in the sidebar that appears.

# Flow strength

The flow strength determines how high the outflow is at the source and the inflow at the sink.

You can choose here whether to enter a formula or make the value dependent on a control element.

By default, new flows are set to the formula field. A simple value can be entered here, but you can also enter a formula that uses the values of the action network. Read more in the documentation for the formula field.

With the “Reference value” setting, you can select an element from the network. The flow strength then always corresponds to the value of this element. The selected element thus becomes the control element of the flow.

# Sources and Sinks

A flow always has at least one source or sink. A value flows out of source elements. A value flows into sink elements.

Each flow can have several sources and sinks. If several sources are set, the deducted value is divided proportionally. If there are several sinks, the transferred value is distributed proportionally. The exact distribution can be regulated individually in the individual sources and sinks. To do this, simply click on a source or sink.

In the flow branch submenu, you can edit the settings of a source or sink.

Flow limitation

By default, flows are limited by the capacities of the source and sink elements.

Example: A flow connects the source element “Warehouse” with the sink element “Salesroom”. The flow has a capacity of 50 parcels / round. However, there are only 30 parcels left in the warehouse, so the flow is reduced to 30.

This limit can be removed.

Example continuation: This means that 50 parcels would continue to arrive in the salesroom, even if the warehouse is already empty.

Strength

The outflow of a source and the inflow of a sink are normally directly dependent on the strength of the flow. In limited flows, a factor can be defined for how much of the flow strength is subtracted/added at each source or sink.

If a flow is unlimited, a free value can be set via the curve field.

Resources

# About resources

Resources are elements that can be influenced and have a freely definable range of values. Any unit can be assigned to them.

They are suitable for mapping stocks of specific values.
Examples Budget (in €), stock (in packages), seawater (in liters), time (in person-weeks)

Resources can also be used as “costs” of actions. When an action with resource consumption is activated, these input costs are consumed directly by the resource elements concerned.

# Create

Resources can be created either via the sidebar of the model, via the toolbar or via the right-click menu.

Via the sidebar

  1. Open the model sidebar.
  2. Expand the “Elements” section.
  3. In the “Resources” sub-item, enter the title of the new resource in the field labeled “+ new”.
  4. Confirm with Enter.

Via the toolbar

  1. Select the resource icon on the toolbar.
  2. Click in the network or draw a rectangle.
  3. The new resource is in the network. Click on it to give it a name.

Via the right-click menu

  1. Right-click on a free space in the network.
  2. Select “New resource” from the menu that appears.
  3. The new resource is in the network. Click on it to give it a name.

# Scope

Each resource has a current value that can change during a simulation. The value that the resource should have at the start of a simulation is defined in the Initial Value field.

The unit of the resource can be freely determined. In the “Evaluation” area, resources with the same unit are partially grouped in diagrams.

Each resource has a minimum and maximum value. If this is exceeded or undershot during a simulation due to influences, everything outside the specified range is “cut off”: the resource will never assume a higher value than the one specified here.

# Impacts

Resources can have impact relationships with other elements.

The “Impacts” section lists all of the impacts relationships of the resource, subdivided into outgoing and incoming impacts.

Outgoing impacts are used to change other elements when the value of this resource changes.

Incoming impacts change the value of this resource when the value of the linked output element changes.

Click on the “+ new” dropdown in the respective area to create a new impact of this type.

Non-impacts document that there is no impact and are listed separately.

# Self-Driven Dynamic

The self-driven dynamic of a resource controls how the value of the resource changes over time.

The self-driven dynamic can be created in the “Self-Driven Dynamic” section. The self-driven dynamic is then displayed in the network via a small circle in the top left-hand corner of the resource.

If the self-driven dynamic is selected, it can be edited in the sidebar.

In the “Value” section of the self-driven dynamic menu, you can set the change in the resource depending on the value.

How do you read the curve?

The Y-axis determines the value of the change in the resource, the X-axis shows the current value of the resource. During the simulation, the corresponding intrinsic self-driven dynamic value is formed from the current resource value in each simulation step. This value is added to the value of the resource.

The “Interval” section defines how often the element’s self-driven dynamic should take impact.

With an interval of 0, the self-driven dynamic is activated in every simulation step; with an interval of 1, one step is omitted between each activation.

An image for the self-driven dynamic can be set in the “Design” section. The image is displayed in the simulation when the self-driven dynamic is activated.

# Stakeholders

In the “Stakeholders” section, you can document which stakeholders are affected by the resource or have an influence on it.

Stakeholders in simcision have no technical influence on the result of the simulations, they are purely for documentation purposes.

Select which stakeholders are linked to the resource by choosing from existing stakeholders in the list or creating a new one.

Click on a stakeholder entry to open the stakeholder menu, where you can edit each stakeholder directly.

# Design

The visual representation of the resource in the network can be determined under “Design”.

The “Display location” controls whether the resource is to be displayed in the network or only exists hidden in the model.

The “Value display” determines whether the value is displayed in the network as a bar or only as a number.

In addition, the font and background color of the resource can be determined, an image can be uploaded and the title can be hidden.

Indices

# About indices

Indices are elements that cannot be influenced directly.

Their value is derived from the states and values of other elements or variables in the network.

What are indices good for?

  • Result display: As their value can be calculated completely freely, indices can be used to visibly display the results of the simulation. Example: the overall performance of a target model
  • Auxiliary value calculation: An index can be used to perform an intermediate calculation in the model that should trigger something else. Example: Event E is only triggered if the sum of target A and target B is less than 100. This sum is calculated via index I.

# Create

Indices can be created either via the sidebar of the model, via the toolbar or via the right-click menu.

Via the sidebar

  1. Open the model sidebar.
  2. Expand the “Elements” section.
  3. In the sub-item “Indices”, enter the title of the new index in the field labeled “+ new”.
  4. Confirm with Enter.

Via the toolbar

  1. Select the index icon on the toolbar.
  2. Click on the network or draw a rectangle.
  3. The new index is online. Click on it to give it a name.

Via the right-click menu

  1. Right-click in the network at a free position.
  2. Select “New index” from the menu that appears.
  3. The new index is online. Click on it to give it a name.

# Value

The value of an index is always calculated dynamically from other states/values of the model.

In the “Value” area, you can set how the index calculates the value.

There are two input options for the formula for calculating the index:

  • Template
    Select one of the predefined calculation methods and insert the elements that you want to offset against each other. This is the quick, visual way. The formula template can be customized directly in the sidebar or in extended form in the formula editor.
  • Formula
    Enter the calculation formula for the index manually in the formula field. This is suitable for more complex calculations. The formula field allows you to enter a range of mathematical functions, variables and constants. The formula field can be edited in an extended form in the formula editor, where all available references, variables and functions are listed.

# Impacts

Indices can have outgoing impact relationships with other elements (if the value of the index changes, other elements of the network also change).

All impact relationships of the index are listed in the “Impacts” section.

Click on the dropdown to create a new impact relationship to a target or resource in the network. Alternatively, the impact can be created in the network.

It is not possible to have an impact on an index, as indices do not have their own value that could be influenced. Indices are only ever the result of a calculation and therefore cannot be influenced by impacts, flows, events or actions.

# Stakeholders

In the “Stakeholders” section, you can document which stakeholders are affected by the index or have an influence on it.

Stakeholders in simcision have no technical influence on the result of the simulations, they are purely for documentation purposes.

Select which stakeholders are linked to the index by choosing from existing stakeholders in the list or creating a new one.

Click on a stakeholder entry to open the stakeholder menu, where you can edit each stakeholder directly.

# Design

The visual representation of the index in the network can be determined under “Design”.

The “Display location” controls whether the target is to be displayed in the network, listed in front of the network in the top right-hand corner or only exists hidden in the model.

The “Status display” determines whether the state is displayed in the network as a bar or only as a number. Note that the bar display is only possible if the index has a valid minimum and maximum value.

In addition, the font and background color of the index can be determined, an image can be uploaded and the title can be hidden.

Targets

# About targets

Targets are elements that can be influenced and have a value between 0 and 100%. Unlike resources, their value range and unit cannot be changed.

They have indicators that can be used to document how their initial state comes about.

Goals are ideal for models in which normalized and/or abstract values are used.

# Create

Targets can be created either via the sidebar of the model, via the toolbar or via the network right-click menu.

Via the sidebar

  1. Open the model sidebar.
  2. Expand the “Elements” section.
  3. In the “Targets” sub-item, enter the title of the new destination in the field labeled “+ new”.
  4. Confirm with Enter.

Via the toolbar

  1. Select the target icon on the toolbar.
  2. Click on the network or draw a rectangle.
  3. The new target is in the network. Click on it to give it a name.

Via the right-click menu

  1. Right-click in the mesh at a free position.
  2. Select “New target” from the menu that appears.
  3. The new target is in the network. Click on it to give it a name.

# Indicators

The indicators help to capture the meaning of an element more precisely and to define the element statuses.

They can be created using the “+new indicator” field. To do this, enter the name of the desired indicator and confirm by clicking on the small “plus” or by pressing Enter.

The indicator can be removed at any time using the trash can symbol next to its name. The small speech bubble next to the name allows you to add a more detailed description in the form of a comment.

# Status

Each target has a status between 0 and 100%. The starting state of the target can be defined in the “Status” section, either via the slider or via the input field.

This state can be changed dynamically during simulations, but at the start of each simulation the target starts with the value that is set here.

The status can also be set directly at the target in the network: either via the status slider (click and drag) or via the value (double-click, enter new value).

# Impacts

Targets can have impact relationships with other elements.

The “Impacts” section lists all of the target’s impact relationships, subdivided into outgoing and incoming impacts.

Outgoing impacts change other elements when the status of this target changes.

Incoming impacts change the status of this target when the respective linked element changes.

The “Create impact” button takes you to effect mode. There you can define outgoing impacts between this target and other elements.

Non-effects document that there is no impacts and are listed separately.

# Self-Driven Dynamic

The self-driven dynamic of a target controls how the status of the target changes over time.

The self-driven dynamic can be created in the “Self-Driven Dynamic” section. The self-driven dynamic is then displayed in the grid via a small circle in the top left-hand corner of the target.

If the self-driven dynamic is selected, it can be edited in the sidebar.

In the “value” section of the self-driven dynamic menu, you can set the change in the target depending on the status.

How do you read the curve?

The Y-axis determines the value of the change in the target, the X-axis shows the current state of the target. During the simulation, the corresponding self-driven dynamic value is formed from the current target state in each simulation step. This value is added to the state of the target.

The “Interval” section defines how often the element’s self-driven dynamic should take impact.

With an interval of 0, the self-driven dynamic is activated in every simulation step; with an interval of 1, one step is omitted between each activation.

An image for the self-driven dynamic can be set in the “Design” section. The image is displayed in the simulation when the self-driven dynamic is activated.

# Stakeholders

In the “Stakeholders” area, you can document which stakeholders are affected by the objective or have an influence on it.

Stakeholders in simcision have no technical influence on the result of the simulations, they are purely for documentation purposes.

Select which stakeholders are linked to the target by choosing from existing stakeholders in the list or creating a new one.

Click on a stakeholder entry to open the stakeholder menu, where you can edit each stakeholder directly.

# Design

The visual representation of the target in the network can be determined under “Design”.

The “Display location” controls whether the target is to be displayed in the network or only exists hidden in the model.

The “Status display” determines whether the state is displayed in the network as a bar or only as a number.

In addition, the font and background color of the target can be determined, an image can be uploaded and the title can be hidden.

Elements

# About elements

Elements are the basic building blocks of every simcision model. A model usually consists of several different elements that are linked to each other with relationships.

There are three types of elements:

  • Targets
    have a status that ranges between 0 and 100%. Their status can be changed via actions or events in simulations.
  • Resources
    Have a value that can be freely defined, as well as a freely settable unit. Their value can also be controlled in simulations via actions or events.
  • Indices
    are “calculated” values in the system. Their value is derived from the states and values of other elements or variables in the network. As their value is always derived from other values, they cannot be influenced directly.

All elements can be displayed in the network, linked via impacts and flows and designed with colors and images.

# Editing in the network

Many adjustments to elements can be made directly in the network.

  • Double-click the title of the element to change it directly.
  • Double-click on the value of the element to change the number. (For goals and resources)
  • Double-click on the unit to edit it. (For indices and resources)
  • Move the element using drag & drop or adjust the size of the element by dragging one of the edges.


If an element is selected in the network, a control bar appears, which can be used to quickly define further options.

  1. Change type: You can use this to convert an element from one type (target/resource/index) to another. Note that information can always be lost during the conversion, as all element types store slightly different data.
  2. Create impact: Create an impact from this element to another.
  3. Create flow: Create a flow from this element to another.
  4. Change the background color of the element.
  5. Change the font color of the element.
  6. Change the image of the element.
  7. Open pop-up menu with further options.